Take action. Be proactive.
Be prepared.
Know Your Risk
See which zones in your community face the highest fire exposure. Updated weekly so you always have a current picture, not a decade-old map.
Get a Mitigation Plan
Ranked actions by impact. Know exactly where to clear brush, harden structures, and create defensible space — with projected risk reduction per dollar spent.
Prove It to Insurers
Board-ready reports that demonstrate compliance. Show carriers your community is actively mitigating — and keep your coverage.
Built to protect
Vegetation Monitoring
Multi-spectral canopy health, moisture, and fuel accumulation.
Fire Behavior Simulation
Tens of thousands of fire spread simulations. Burn probability with directional vulnerability — how fire moves across the landscape.
Zone-Level Risk Scoring
Composite score per zone: fuel, terrain, moisture, weather, structural exposure.
Mitigation Action Plans
Ranked actions per zone with projected risk reduction. Clear, thin, break — modeled individually and combined so you know where every dollar goes.
Optimized fuel break placement
Know exactly where to clear — and why it matters there.
Every acre justified
Clearing is targeted where fire routes converge toward structures, not just where fire burns frequently.
Layered defense
Multiple independent corridors that address different fire approach vectors.
Quantified impact
Every corridor reports the burn probability it intercepts and the structures it shields. Prioritize by cost-effectiveness.
Validate before you break ground
Re-simulate optimized corridors to measure projected risk reduction before any crew mobilizes.
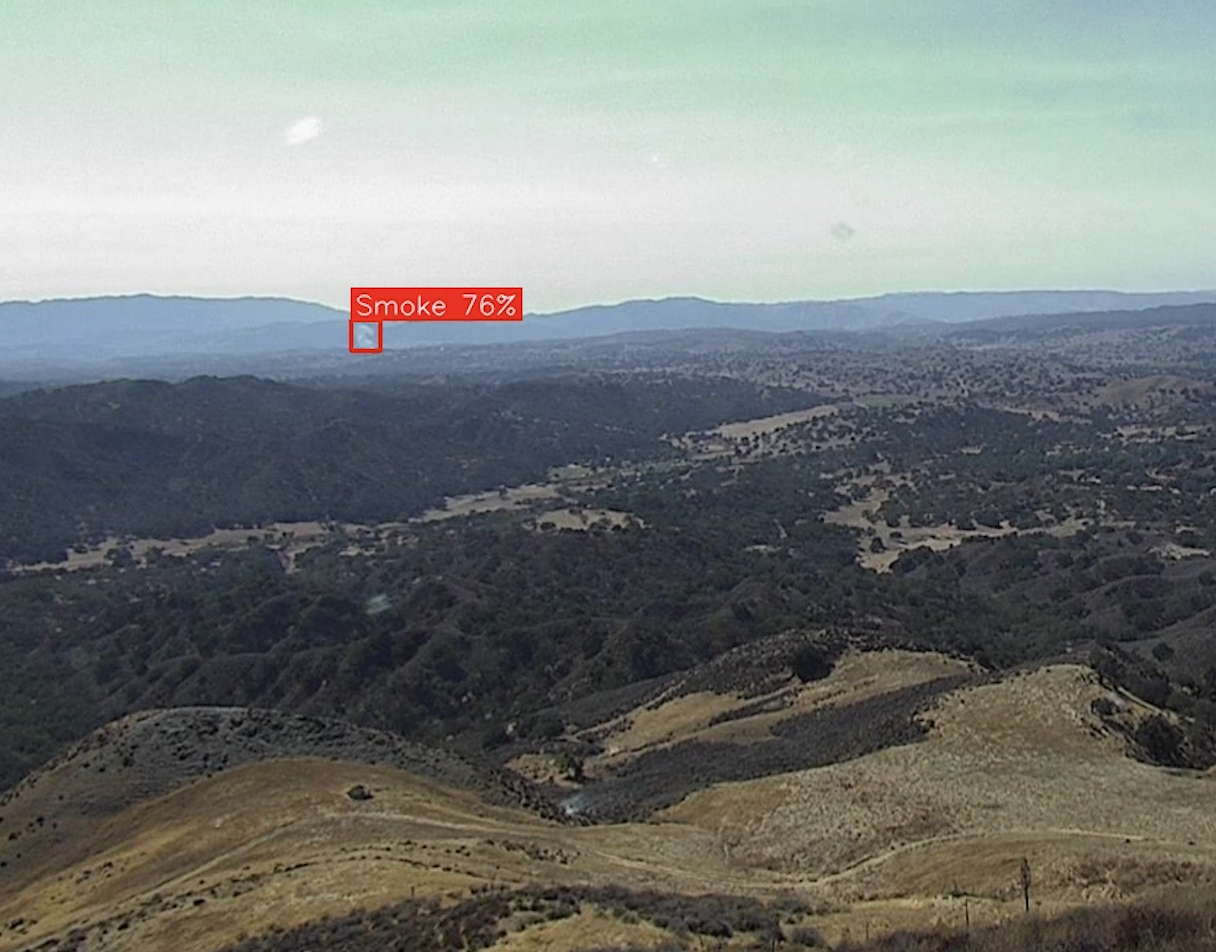
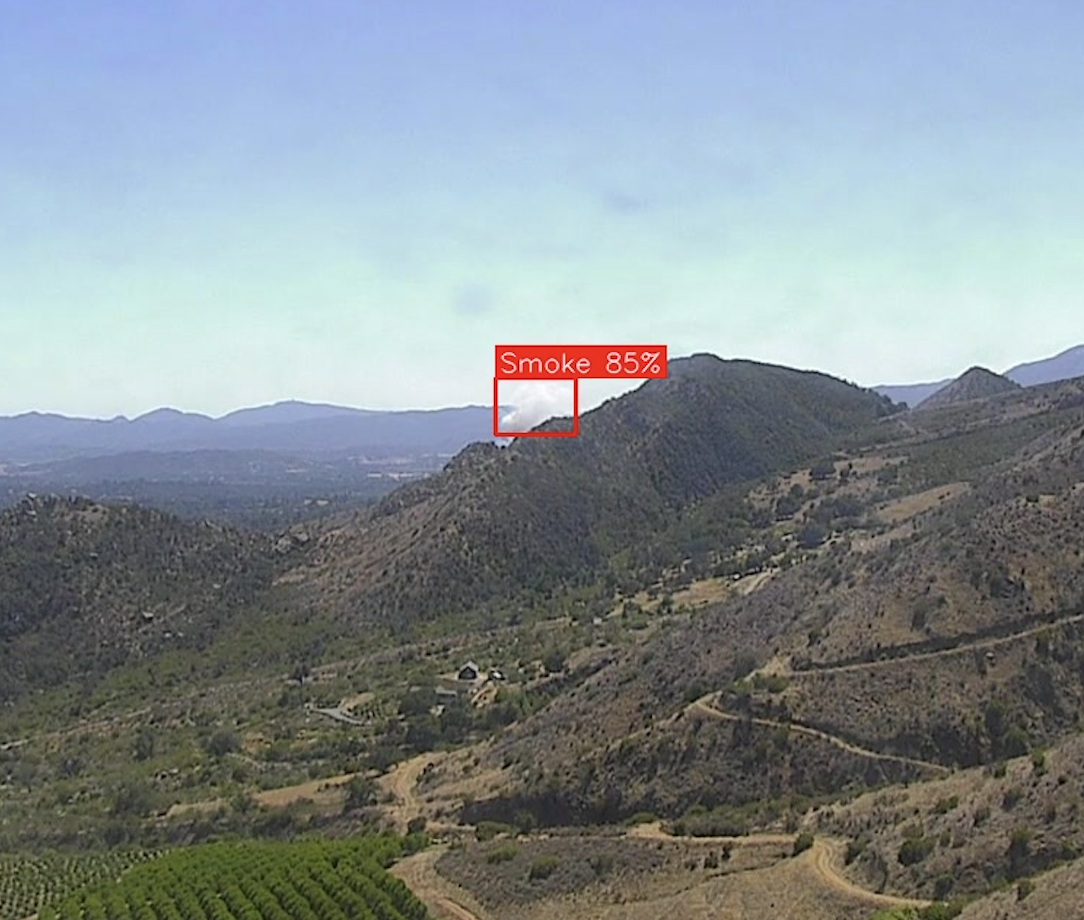
Smoke detection on camera networks
AI-powered smoke detection across wildfire camera feeds. One API call returns bounding boxes with confidence scores — day or night.
See what your community's risk looks like
Reach out for a sample risk assessment of your community.
Get in Touch